Production continued to rise across the observed span
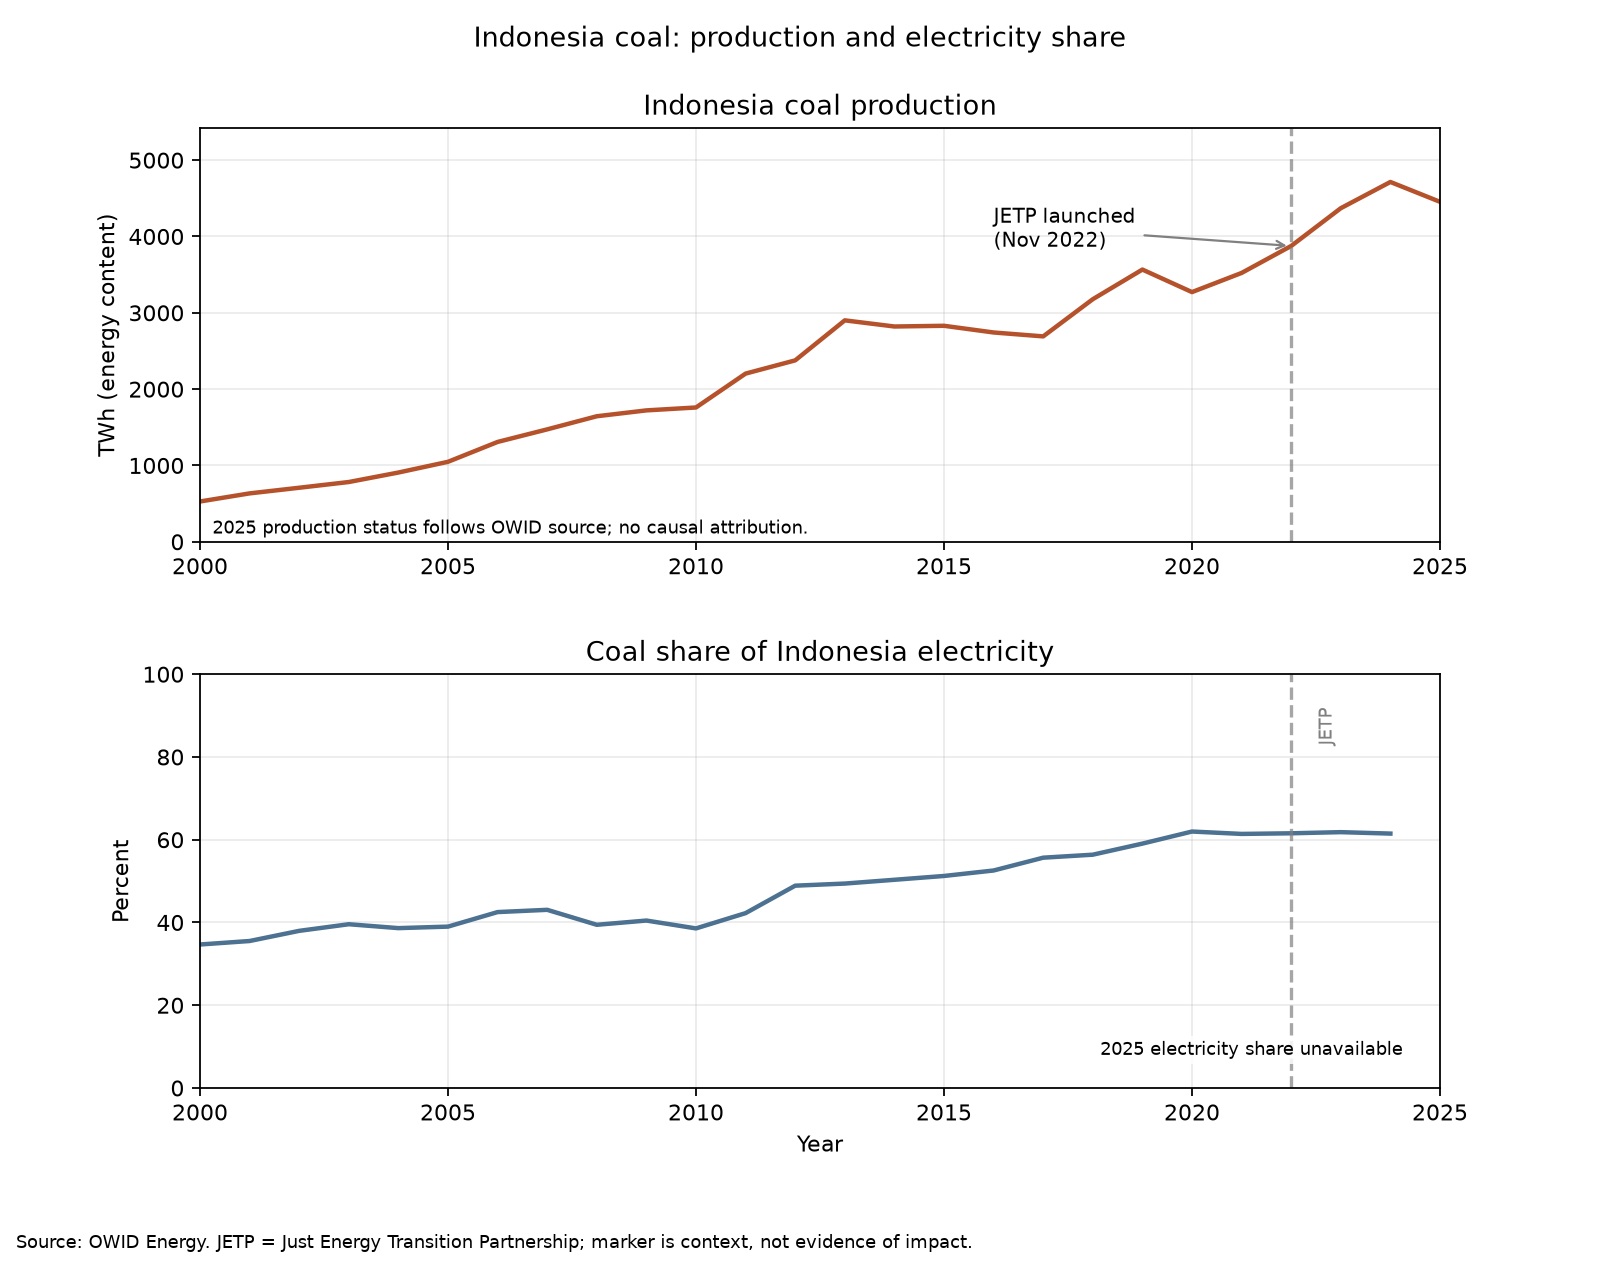
OWID records 527.96 TWh of Indonesian coal production in 2000 and 4,454.13 TWh in 2025. Production is energy content—not electricity generated, export revenue, or an emissions estimate.
Coal production and coal’s electricity share tell different stories. Set beside a global price benchmark and the 2022 JETP launch, the series offer context—not evidence that one caused another.
Figures below come from the project’s downloaded source files and annual outputs. Period coverage differs by measure.
The 2025 electricity fields are missing. No 2025 electricity-share value is shown or inferred. Benchmark values are annual means of monthly observations.
Charts are generated by analyze.py from local source snapshots. JETP marker provides date context only.
Observations describe these measured series. They do not explain why values changed.
OWID records 527.96 TWh of Indonesian coal production in 2000 and 4,454.13 TWh in 2025. Production is energy content—not electricity generated, export revenue, or an emissions estimate.
Coal accounted for 61.48% of Indonesia’s electricity in 2024, latest available year here. Source electricity fields for 2025 are missing; missing does not mean zero.
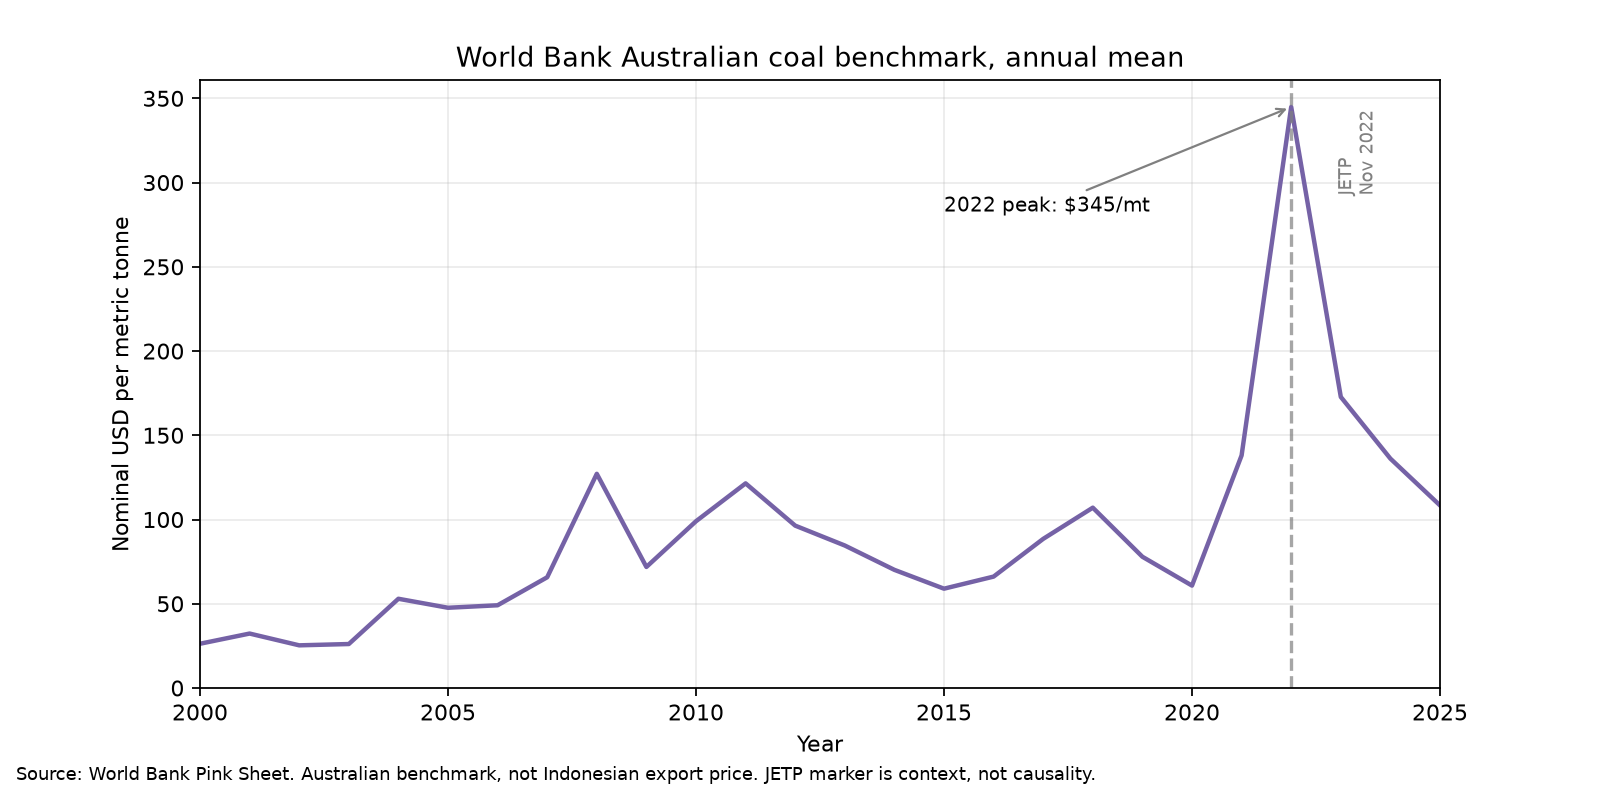
Australian benchmark annual mean reached nominal USD 344.91/mt in 2022 and was USD 108.39/mt in 2025. This benchmark is neither Indonesia’s domestic coal price nor export realization.
Partnership launched 15 November 2022. Initial US$20 billion commitment comprised US$10 billion pledged by IPG and US$10 billion intended to catalyze private finance via GFANZ. Pledges and intended mobilization are not disbursements.
Local charts and annual CSV outputs are included in this project. External links below identify upstream sources; page itself uses no CDN or remote assets.
Indonesia production and electricity indicators. Local input: owid_energy.csv. Annual output: outputs/indonesia_coal_annual.csv. OWID catalog identifies data as CC BY 4.0; upstream providers may have separate terms.
“Coal, Australian” monthly benchmark, aggregated as mean of 12 months for complete calendar years. Local input: world_bank_pink_sheet_2026.xlsx, updated 3 Nov 2026. Output: outputs/australian_coal_annual.csv. Monthly source prices are nominal USD.
Launch date and initial commitment description from project documentation. Funding amounts describe commitments/pledges and intended mobilization, not disbursement totals. Progress report is not analyzed here.
Run .venv/bin/python analyze.py from project root to rebuild local outputs. Credit OWID and upstream providers, and “The World Bank: Commodity Price Data (The Pink Sheet)”; check provider terms before redistributing source data. No project-code license specified.
OWID Indonesia production: 26 annual observations, 2000–2025. Coal electricity share available through 2024; 2025 fields missing. Pink Sheet benchmark: 12 monthly observations per complete year, 2000–2025. Annual mean excludes incomplete years. Analysis validates required fields, unique annual/month keys, positive observed prices, nonnegative production, and electricity-share bounds. Missing values remain missing, not imputed.